By Don Phipps, CEO and Founder, Applied Marketing Research

Analyzing IRI data can provide marketing insights that can lead to better tactical and strategic decision-making. However, for persons working with IRI data, it can be complex, confusing and challenging. That’s why Applied consults regularly with clients on IRI data and is often called upon to analyze quarterly data for brands and products. While not a cookbook per se, here are the steps Applied takes to simplify IRI data.

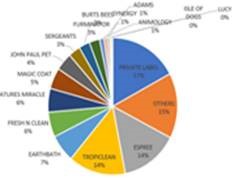
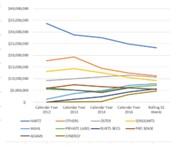
First, we summarize a year’s worth of sales volume geographically and by distribution channel (grocery stores, Walmart, other big box) for each product category. Specifically, we extract the sales volume and average selling price information for each brand within the category and for each sub-segment within the category (for example, snacks vs. beverages). The key here is to develop the share percentage of a given brand relative to other brands and to look at this longitudinally over a period of several years.
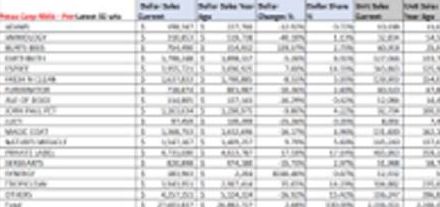
Once we have completed the long-term view, we look more narrowly at overall sales volume and changes for each product category by brand, location, channel and product type. To understand trending data, it’s important to Itemize the sales information for each brand under a given category, analyze the share percentage of each brand, and compare that year over year for as far back as a client requires.
Another analysis we perform is to look at this same data by sales price. Have prices risen, been stable, or dropped over a given period? To do this, we extract a product’s sales from the IRI-supplied raw data file. We then summarize a full year sales volume and average selling price by location and channel. Afterwards, we Identify and categorize the brand sales and analyze the dollars/unit and selling price changes over a given period of years for each product category (for example, price of male deodorants vs. the price of female deodorants). The key here is again to provide a trended look at the price of products within a category over the past several years.

A client uses our analysis to describe what is going on in the market. For example, is a particular product category in decline or is it growing? Within a product category, are certain brands experiencing faster drops or increases in market share than others? What about by channel? Are Walmart’s sales in a given category growing faster than other channels?
Other questions are more strategic. Should a client attempt to spend money to increase awareness and trial in a given category? And what if the product category is trendy? How does that affect budgeting to increase awareness and trial? While we leave those questions to the client, the client is able to make more informed decisions based on our analysis.
Hope your IRI analysis bodes well for you!
